Introduction
This skill turns data into publication-ready scientific figures with reproducible code. It defines variables, units, statistics, and the figure’s purpose, chooses suitable axes, colors, and panel layouts, and checks cropped scales, excessive smoothing, hidden samples, significance labels, and color accessibility. Final figures remain linked to source tables. Confidence intervals, repeated measures, and missing values are handled explicitly so the visual does not imply more than the data support.
Use Cases
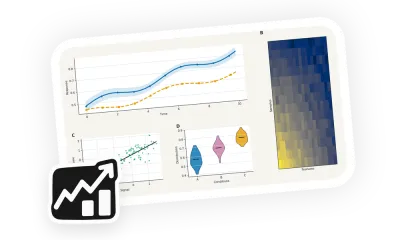
Use it for lines, scatterplots, distributions, heatmaps, multi-panel results, and journal figure redesign, with vector or high-resolution export and consistent typography, line weights, and annotations across a figure set.
Template
Provide the data, variable definitions, comparison question, statistics, target venue, size, and file format. The output includes code, figures, source tables, captions, palette notes, and validation.